Portal Foundation
TRENDAI ANALYTICS
Stock analysis tool with pattern recognition and signal scoring.
TrendAI Analytics
What It Is
Stock analysis platform that combines technical indicators, pattern recognition, and sentiment data to generate trading signals. Outputs include entry/exit prices, stop-loss levels, and confidence scores.
The Problem
Traders must:
- Interpret multiple technical indicators manually
- Filter noise in volatile markets
- Connect sentiment and fundamentals to price action
- Determine signal reliability
The Solution
Automated analysis:
- Pattern recognition across timeframes
- Multi-factor signal scoring
- Entry, target, and stop-loss levels
- Confidence ratings
- Visual charts with annotations
How It Works
- Pull data from Tiingo API and sentiment feeds
- Run pattern recognition and indicator analysis
- Generate signals with confidence scores
- Display charts with entry/exit levels
- Available via CLI or web interface
Technical Indicators
- Moving averages (20, 50, 200-day)
- RSI, MACD, Bollinger Bands
- Volume analysis
- Breakout detection
Pattern Recognition
| Pattern | Detection |
|---|---|
| Double top/bottom | Yes |
| Head and shoulders | Yes |
| RSI divergence | Yes |
| Golden/death cross | Yes |
| Higher lows/lower highs | Yes |
Each pattern receives a confidence score.
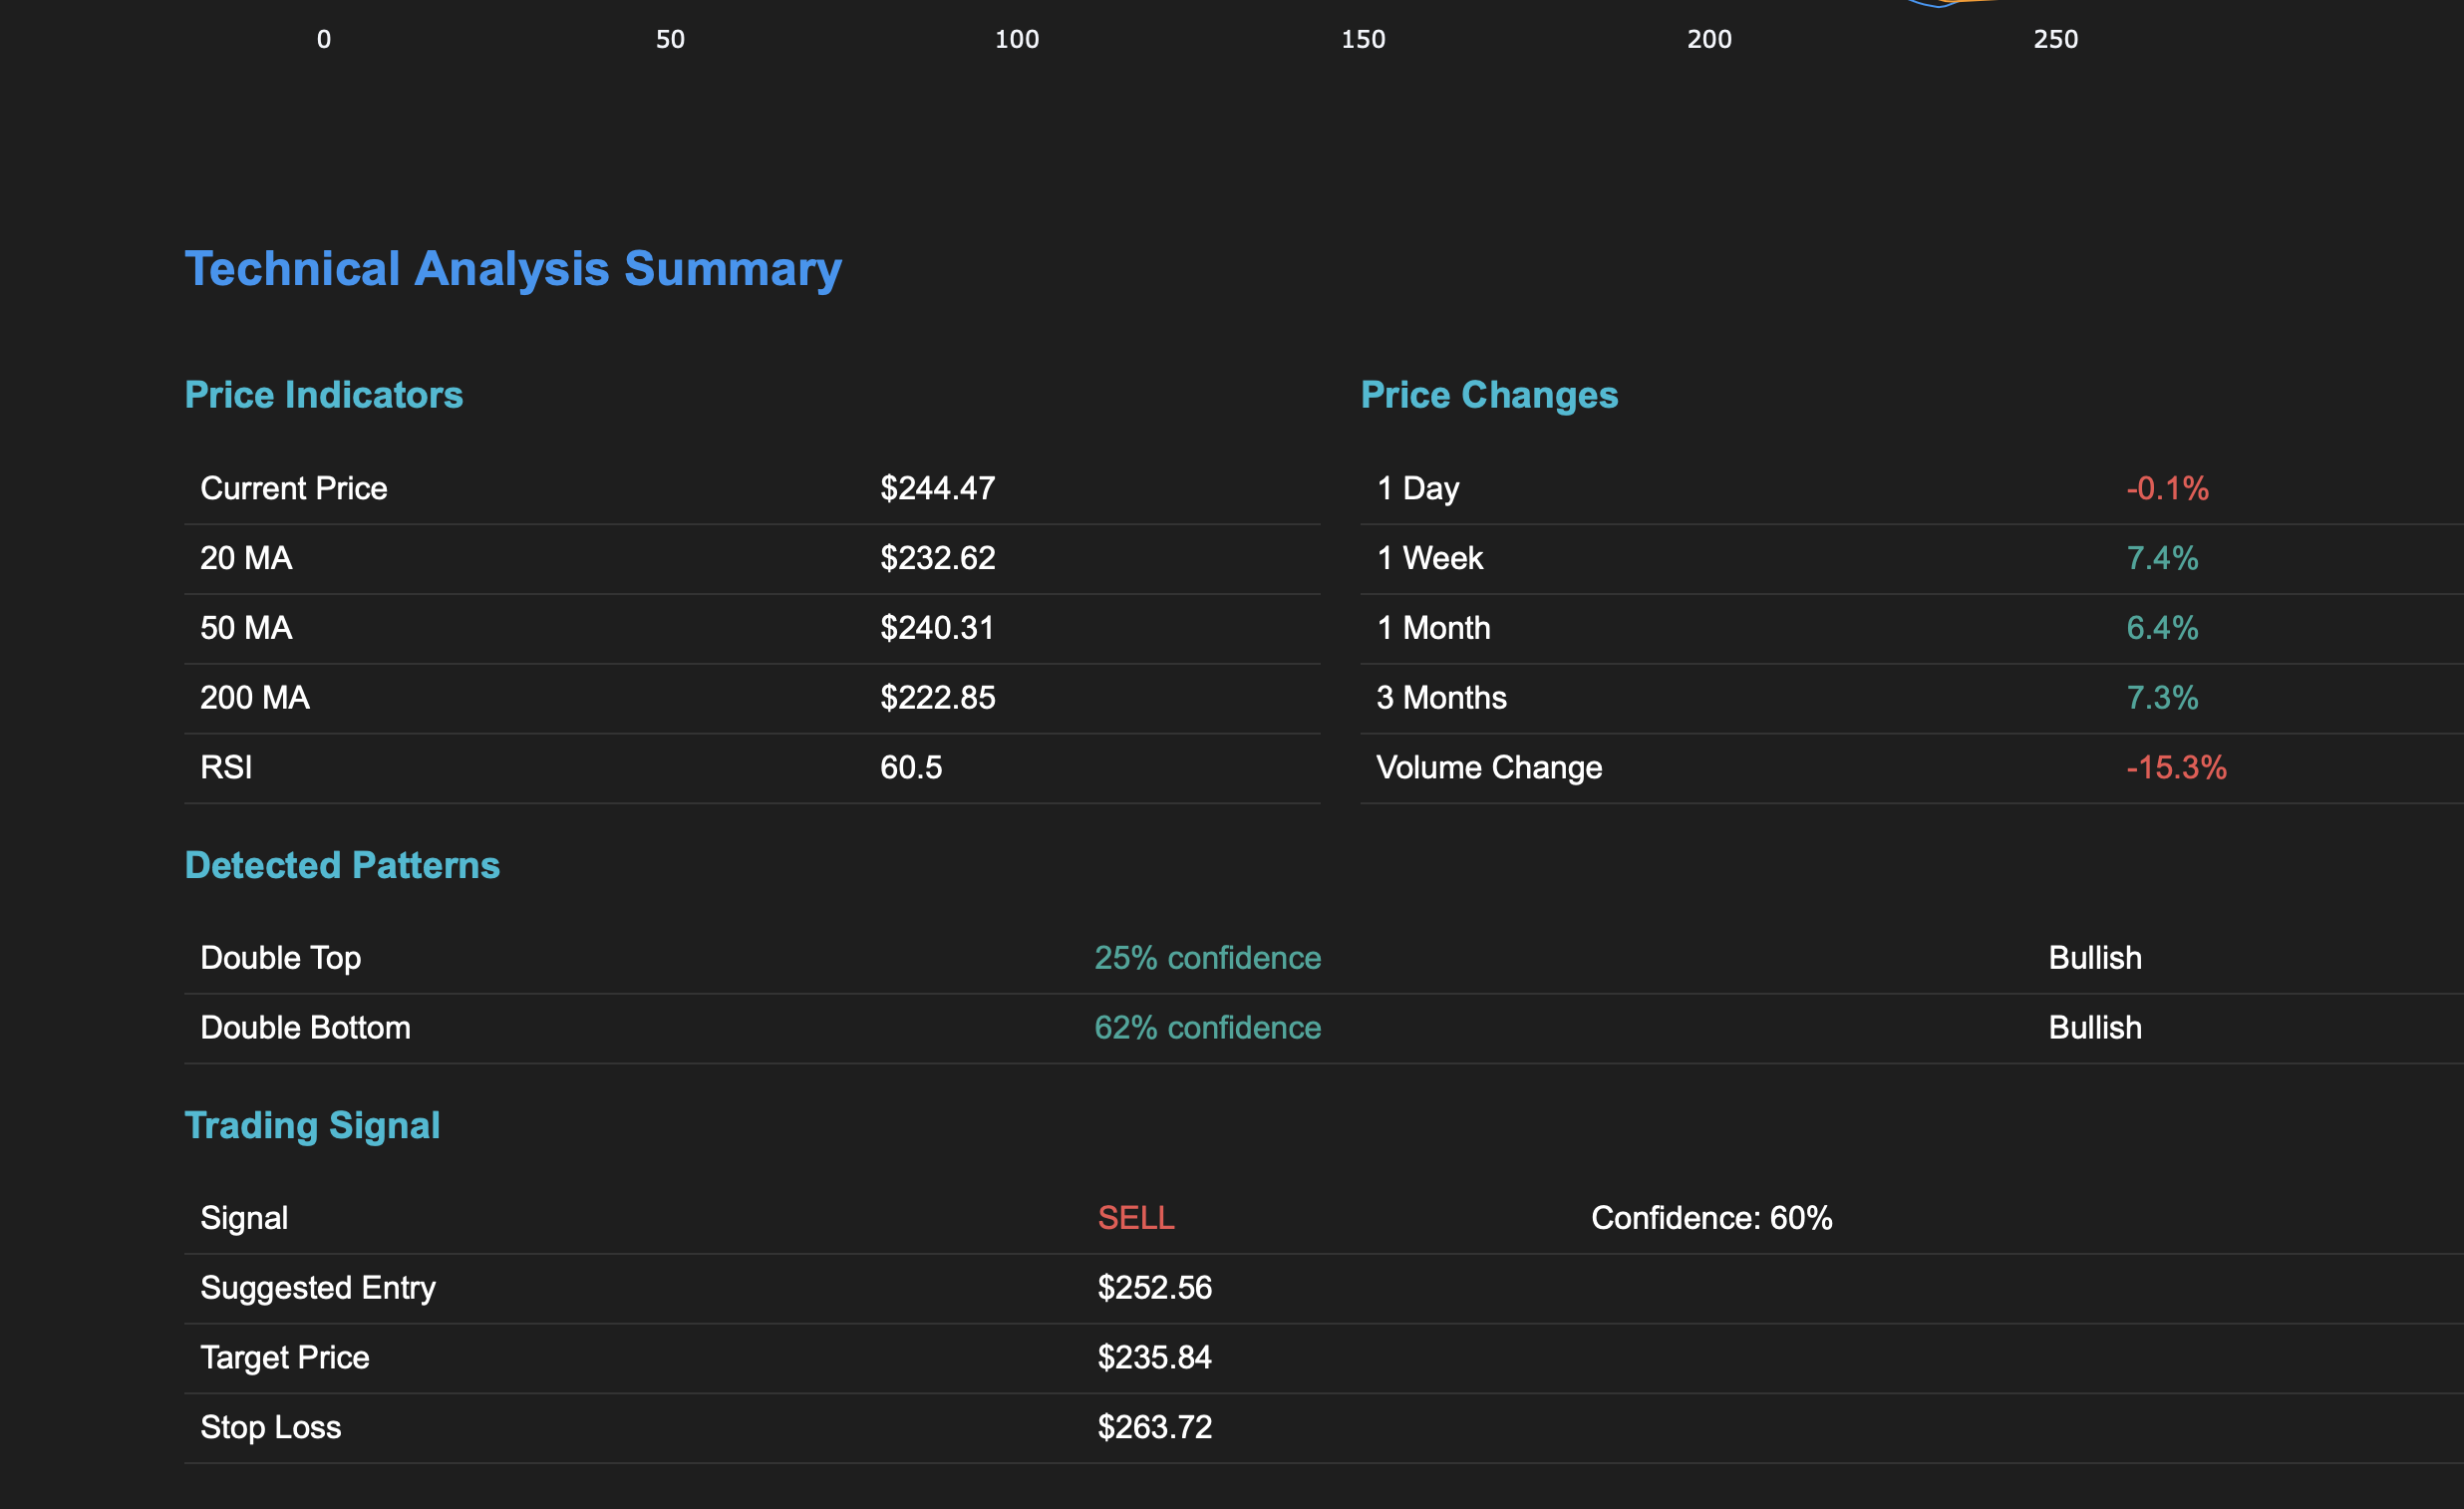
Signal Output
- BUY, SELL, or NEUTRAL classification
- Entry price
- Target price
- Stop-loss level
- Signal rationale
- Confidence score
Technical Stack
Data
- Tiingo API for price and fundamentals
- TextBlob for sentiment analysis
Analysis
- TrendAnalyzer for indicators
- PatternDetector for chart patterns
- SignalGenerator for scoring
Visualization
- Plotly for charts
- Candlestick with volume overlays
- Pattern annotations
Development Status
| Milestone | Target | Status |
|---|---|---|
| Core analysis engine | Q2 2025 | Complete |
| Multi-factor scoring | Q2 2025 | Live |
| Charting and summaries | Q3 2025 | In Progress |
| Portfolio backtesting | Q4 2025 | Planned |
| Web platform | Q4 2025 | Planned |